This is a helper function that simplifies adding and deleting edges to/from graphs.
Value
A special object that can be used with together with igraph graphs and the plus and minus operators.
Details
edges() is an alias for edge().
When adding edges via +, all unnamed arguments of
edge() (or edges()) are concatenated, and then passed to
add_edges(). They are interpreted as pairs of vertex ids,
and an edge will added between each pair. Named arguments will be
used as edge attributes for the new edges.
When deleting edges via -, all arguments of edge() (or
edges()) are concatenated via c() and passed to
delete_edges().
See also
Other functions for manipulating graph structure:
+.igraph(),
add_edges(),
add_vertices(),
complementer(),
compose(),
connect(),
contract(),
delete_edges(),
delete_vertices(),
difference(),
difference.igraph(),
disjoint_union(),
igraph-minus,
intersection(),
intersection.igraph(),
path(),
permute(),
rep.igraph(),
reverse_edges(),
simplify(),
transitive_closure(),
union(),
union.igraph(),
vertex()
Examples
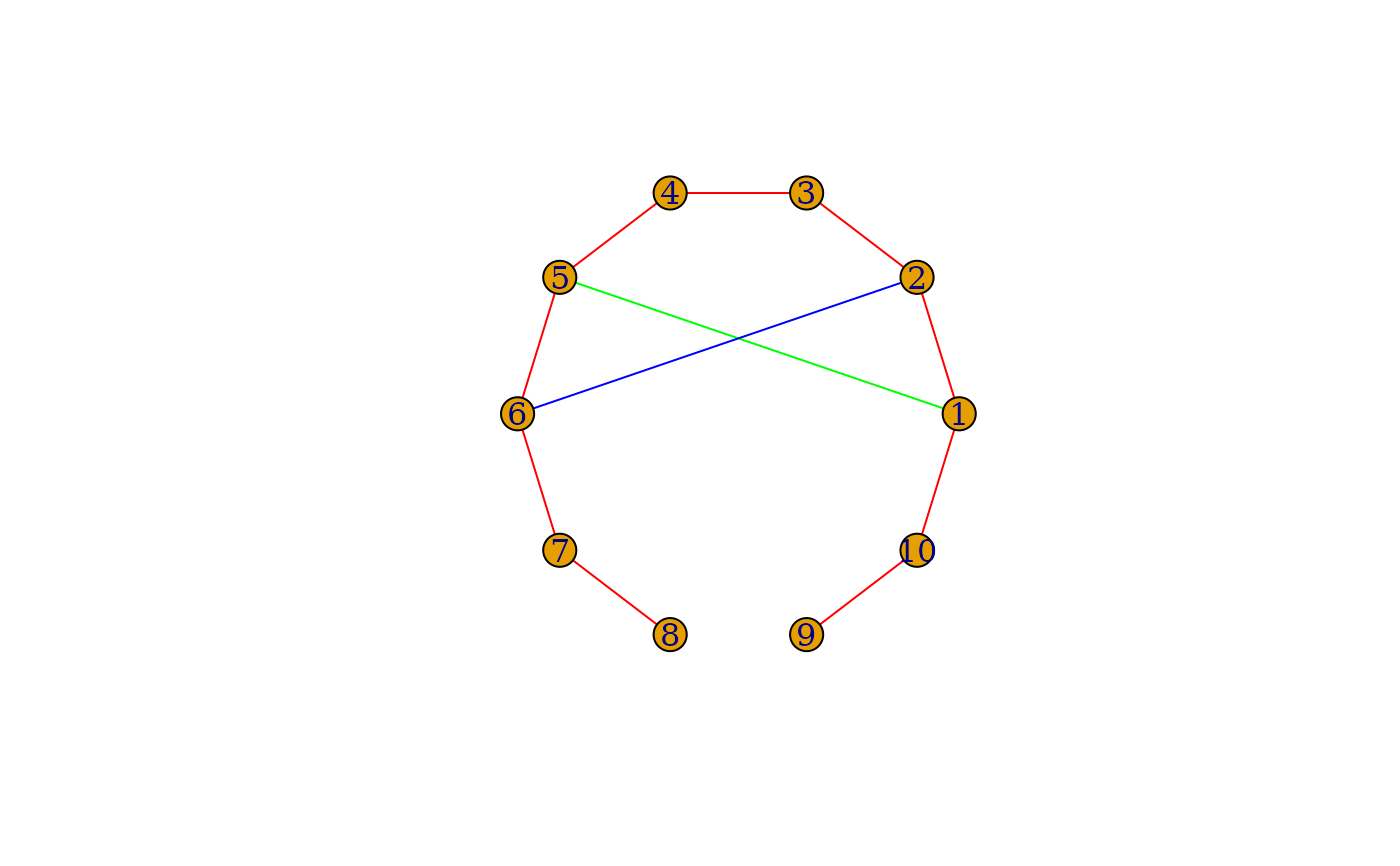
g <- make_ring(10) %>%
  set_edge_attr("color", value = "red")

g <- g + edge(1, 5, color = "green") +
  edge(2, 6, color = "blue") -
  edge("8|9")

E(g)[[]]
#> + 11/11 edges from 140fe9d:
#>    tail head tid hid color
#> 1     1    2   1   2   red
#> 2     2    3   2   3   red
#> 3     3    4   3   4   red
#> 4     4    5   4   5   red
#> 5     5    6   5   6   red
#> 6     6    7   6   7   red
#> 7     7    8   7   8   red
#> 8     9   10   9  10   red
#> 9     1   10   1  10   red
#> 10    1    5   1   5 green
#> 11    2    6   2   6  blue

g %>%
  add_layout_(in_circle()) %>%
  plot()


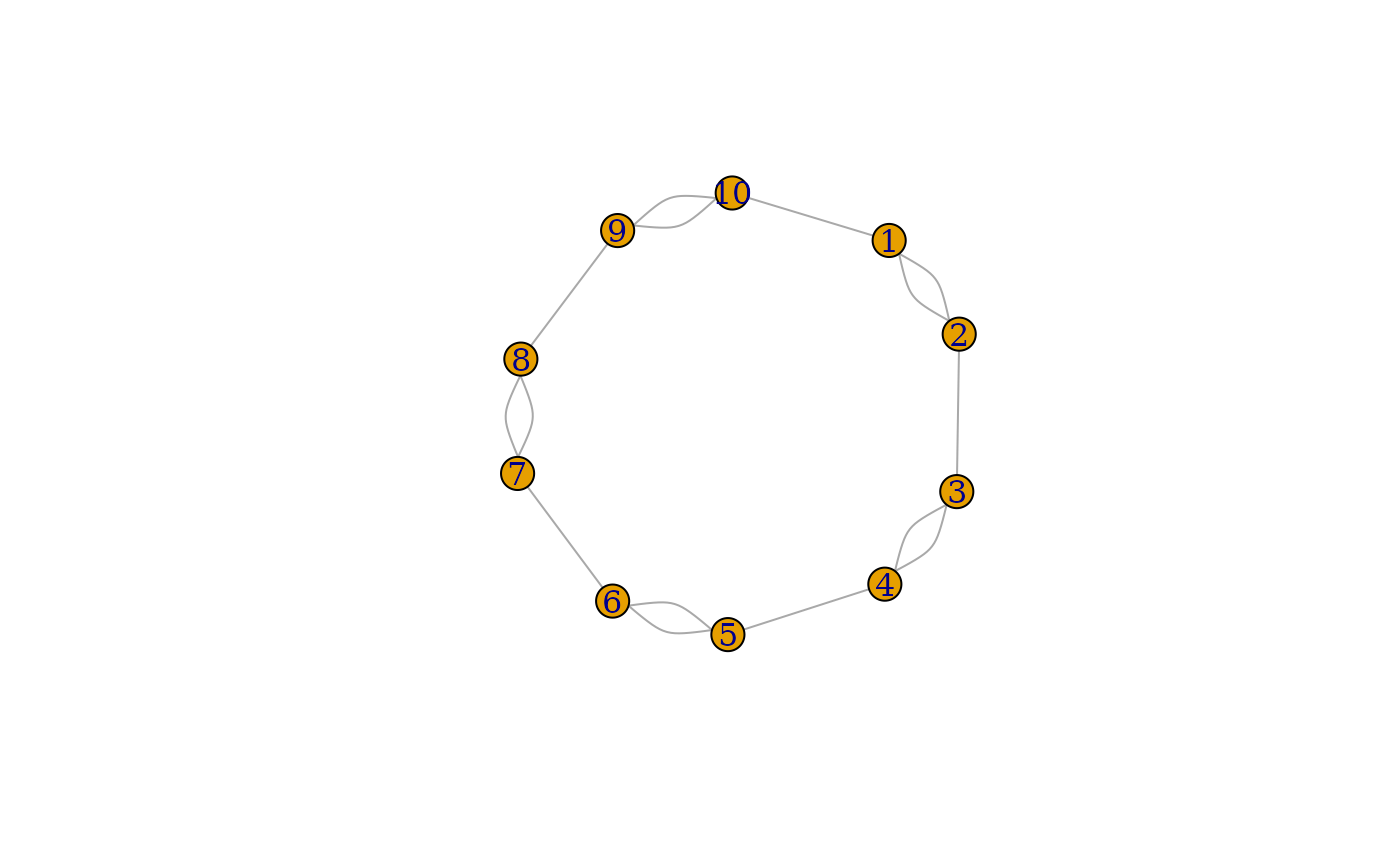
g <- make_ring(10) + edges(1:10)
plot(g)

