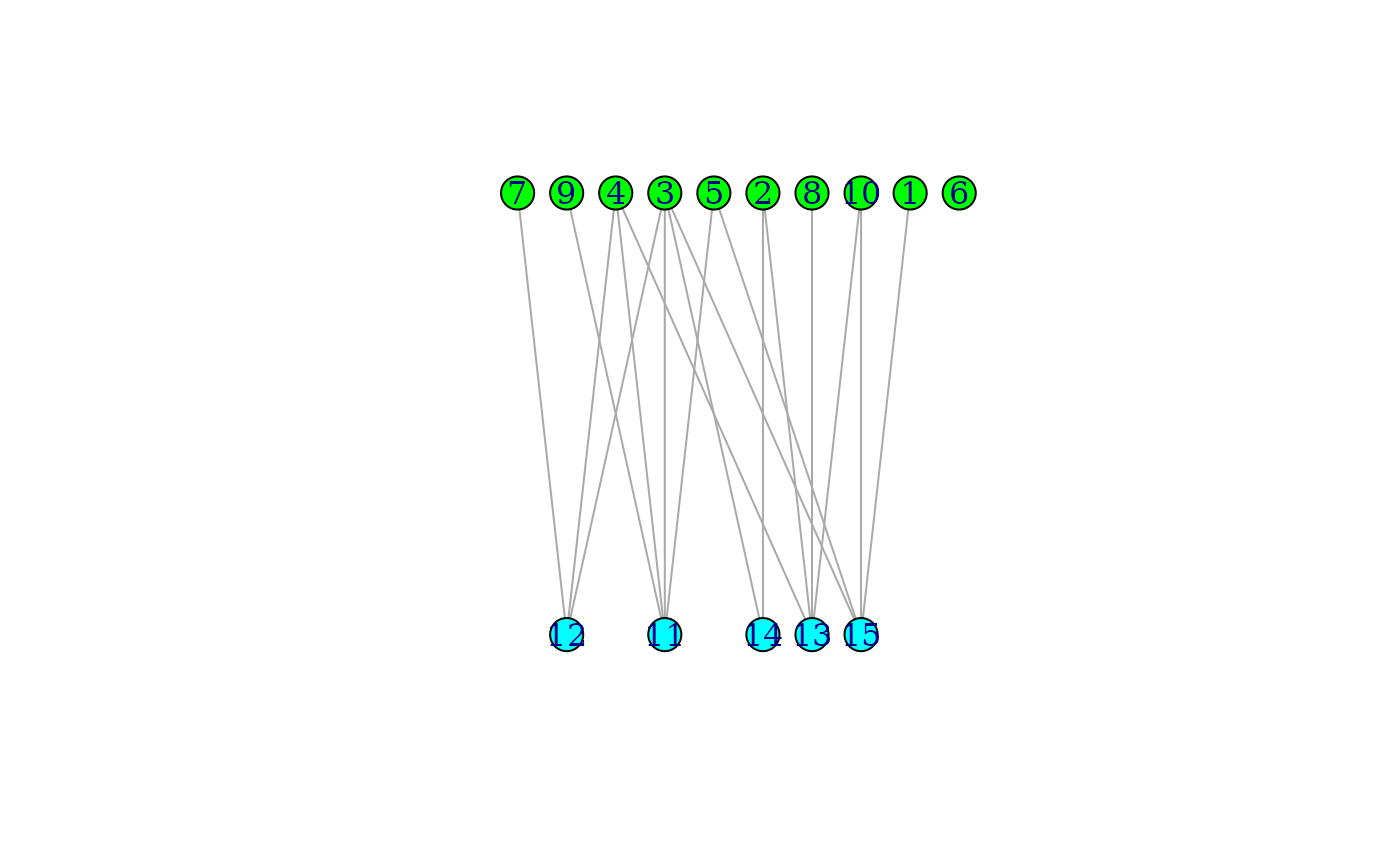
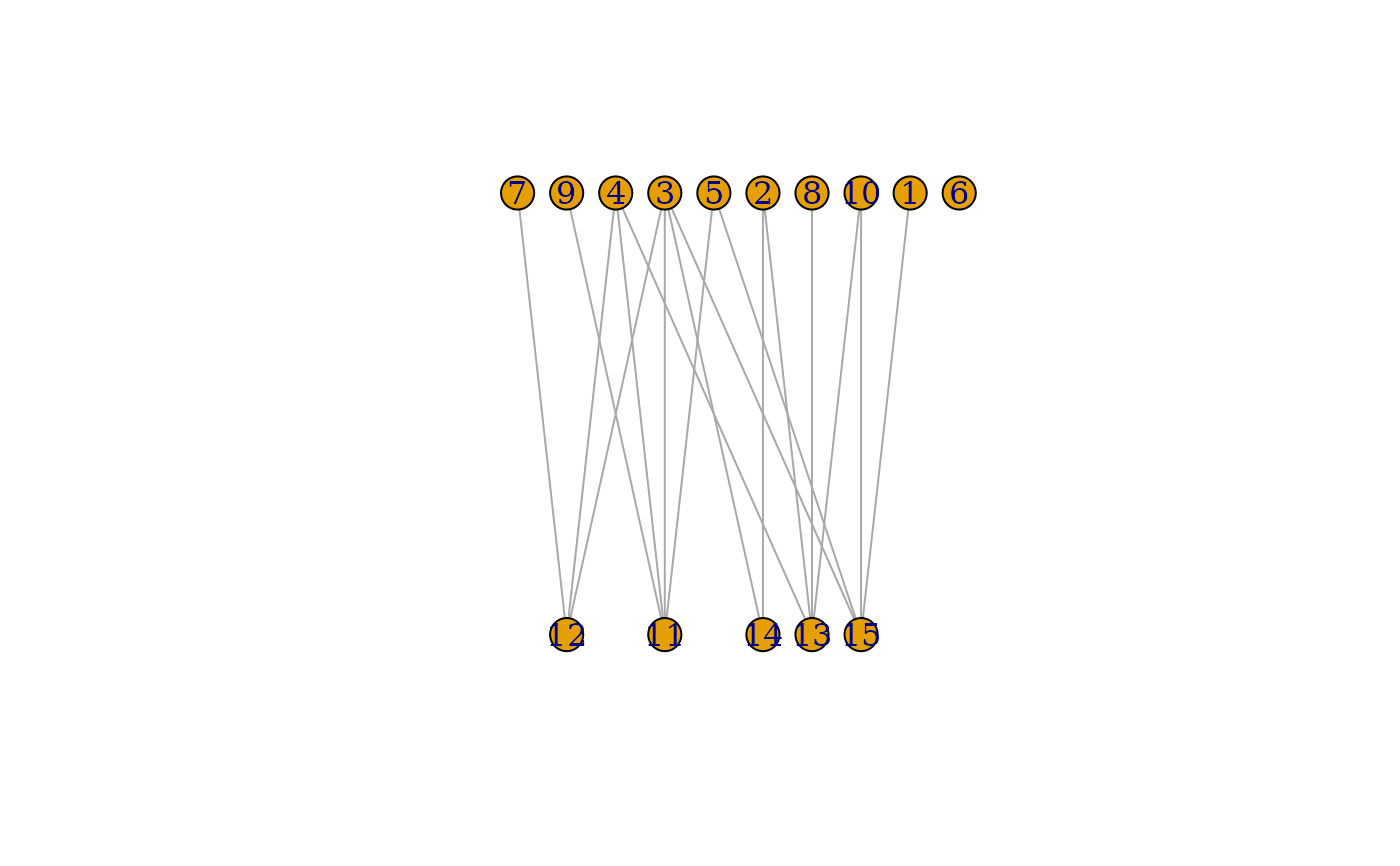
Minimize edge-crossings in a simple two-row (or column) layout for bipartite graphs.
Arguments
- graph
The bipartite input graph. It should have a logical ‘
type’ vertex attribute, or thetypesargument must be given.- types
A logical vector, the vertex types. If this argument is
NULL(the default), then the ‘type’ vertex attribute is used.- hgap
Real scalar, the minimum horizontal gap between vertices in the same layer.
- vgap
Real scalar, the distance between the two layers.
- maxiter
Integer scalar, the maximum number of iterations in the crossing minimization stage. 100 is a reasonable default; if you feel that you have too many edge crossings, increase this.
- ...
Arguments to pass to
layout_as_bipartite().
Details
The layout is created by first placing the vertices in two rows, according
to their types. Then the positions within the rows are optimized to minimize
edge crossings, using the Sugiyama algorithm (see
layout_with_sugiyama()).
See also
Other graph layouts:
add_layout_(),
component_wise(),
layout_(),
layout_as_star(),
layout_as_tree(),
layout_in_circle(),
layout_nicely(),
layout_on_grid(),
layout_on_sphere(),
layout_randomly(),
layout_with_dh(),
layout_with_fr(),
layout_with_gem(),
layout_with_graphopt(),
layout_with_kk(),
layout_with_lgl(),
layout_with_mds(),
layout_with_sugiyama(),
merge_coords(),
norm_coords(),
normalize()
Author
Gabor Csardi csardi.gabor@gmail.com