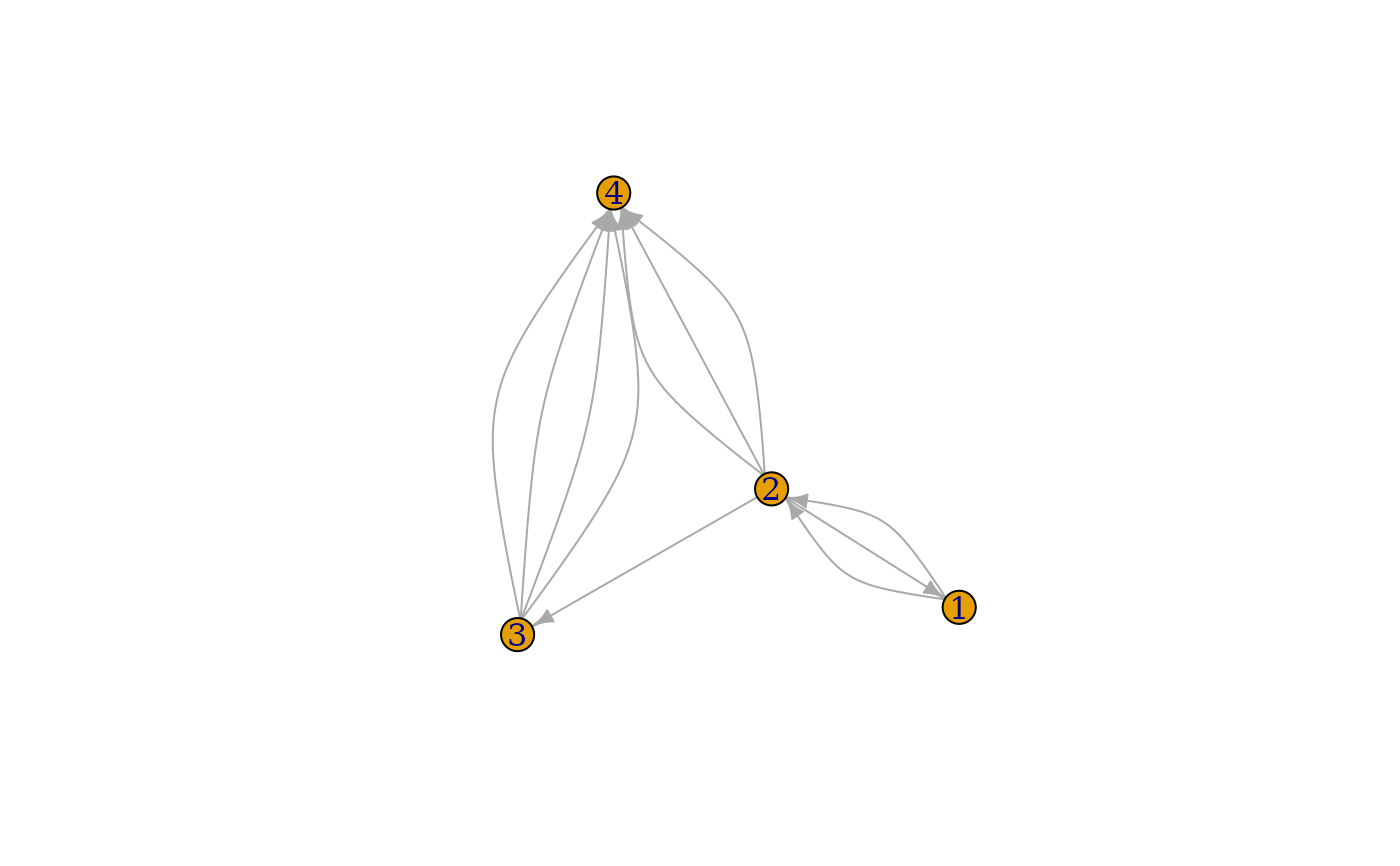
If graphs have multiple edges, then drawing them as straight lines does not show them when plotting the graphs; they will be on top of each other. One solution is to bend the edges, with diffenent curvature, so that all of them are visible.
Details
curve_multiple() calculates the optimal edge.curved vector for
plotting a graph with multiple edges, so that all edges are visible.
See also
igraph.plotting for all plotting parameters,
plot.igraph(), tkplot() and rglplot()
for plotting functions.
Author
Gabor Csardi csardi.gabor@gmail.com
Examples
g <- make_graph(c(
  0, 1, 1, 0, 1, 2, 1, 3, 1, 3, 1, 3,
  2, 3, 2, 3, 2, 3, 2, 3, 0, 1
) + 1)

curve_multiple(g)
#>  [1] -0.5000000  0.0000000  0.0000000 -0.5000000  0.0000000  0.5000000
#>  [7] -0.5000000 -0.1666667  0.1666667  0.5000000  0.5000000

set.seed(42)
plot(g)